
COVER CROPS IN THE US: Current status and trends
Topics: Cover Crops, CRA Resources,
In the last decade, we’ve seen remarkable growth of cover cropping use in every crop-producing region of the US1. According to the 2017 USDA Census of Agriculture, over 150,00 farms reported using cover crops. Here, we provide an overview of cover cropping trends in the US, with a few key statistics and figures that illustrate this progress.
The Center for Regenerative Agriculture maintains data on cover cropping. For further details or questions, contact us at https://cra.missouri.edu/contact/.
Growth of cover crop acreage on US farmland
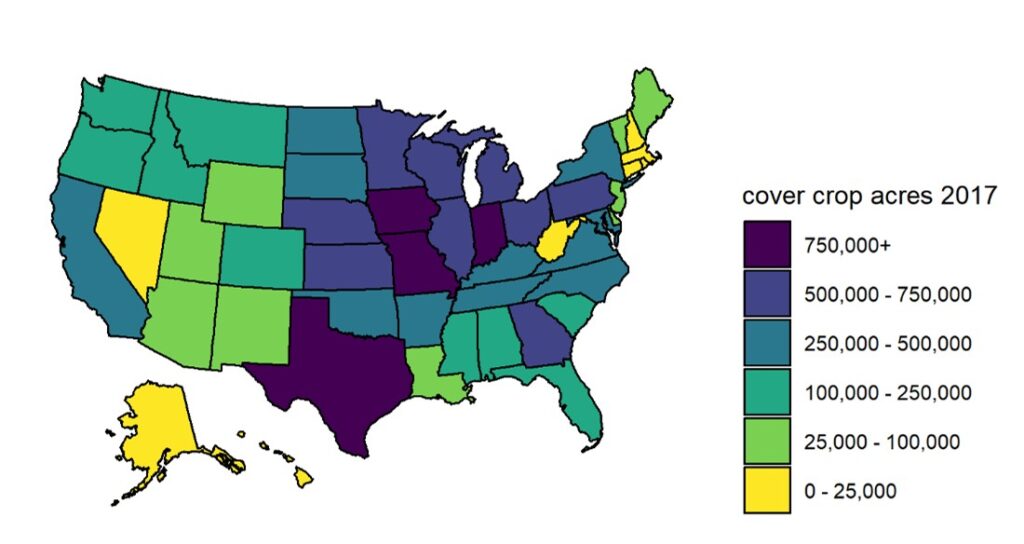
2012 – 10.3 million acres*
2017 – 15.4 million acres*
2020 – estimated 20 million acres**
*2012 and 2017 figures are from the USDA Census of Agriculture, which is conducted once every 5 years and has provided the most accurate figures on cover crop acreage
**Acres for 2020 are estimated by Center for Regenerative Agriculture staff and are based on growth rates documented by the SARE/CTIC National Cover Crop Survey and Census data.
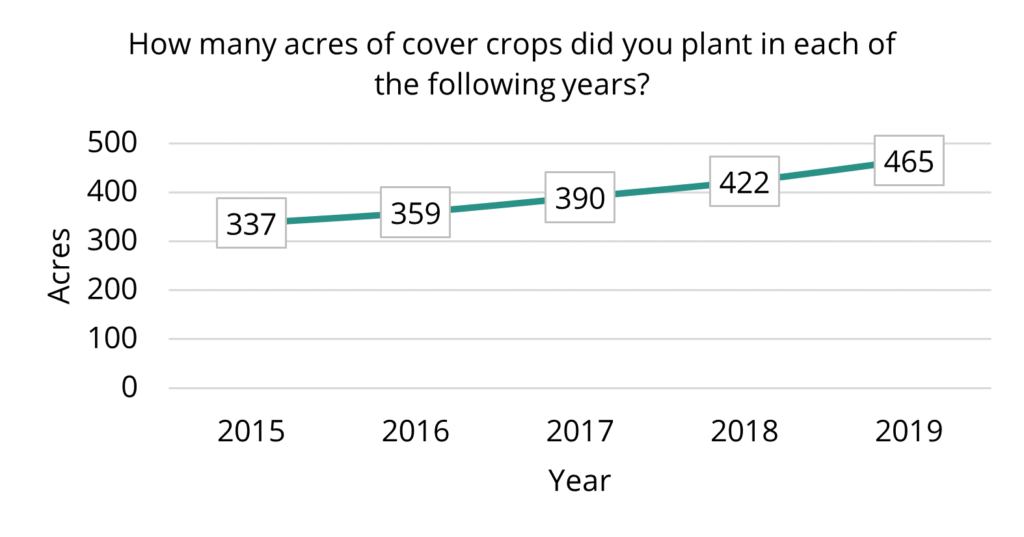
Increase in average cover crops acreage per farm
These findings indicate a significant increase in the number of farm operations planting cover crops, but the growth rate of cover crop acres per farm was even more substantial, illustrating how once farmers started to use cover crops, they continued to expand their acreage. The most recent SARE/CTIC National Cover Crop Survey similarly found a steady increase in average acreage planted to cover crops per farm between 2015 and 2019 (Figure 2).
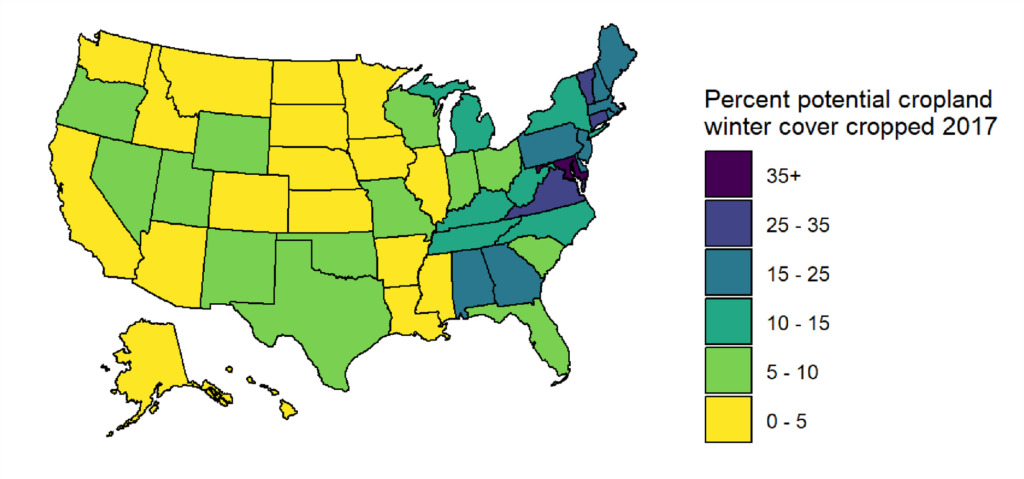
Potential for further adoption of cover crops
While the rise in cover crop usage is promising, there remains significant potential for expanded use of cover crops. The available cropland planted to winter cover crops in 2017 varied from under 5% in some states to over 30% in others (Figure 3).
Further resources on cover crop acreage
1The USDA Sustainable Agriculture Research and Education (SARE) program has partnered with the Conservation Technology Information Center (CTIC) to conduct periodic National Cover Crop Surveys, starting in 2012, with the most recent survey conducted in early 2020. The American Seed Trade Association has also provided support for these surveys. Surveys have included questions about farmer acreage of cover crops and many other topics. See survey reports at: https://www.sare.org/publications/cover-crops/national-cover-crop-surveys/
2The Center of Regenerative Agriculture staff cooperated with the Soil Health Institute to publish a detailed assessment of cover crop acreage as part of a 2019 report entitled “Adoption of Soil Health Systems Based on Data from the 2017 U.S. Census of Agriculture.” See: https://cra.missouri.edu/adoption-of-soil-health-systems-usda-census-of-agriculture/
